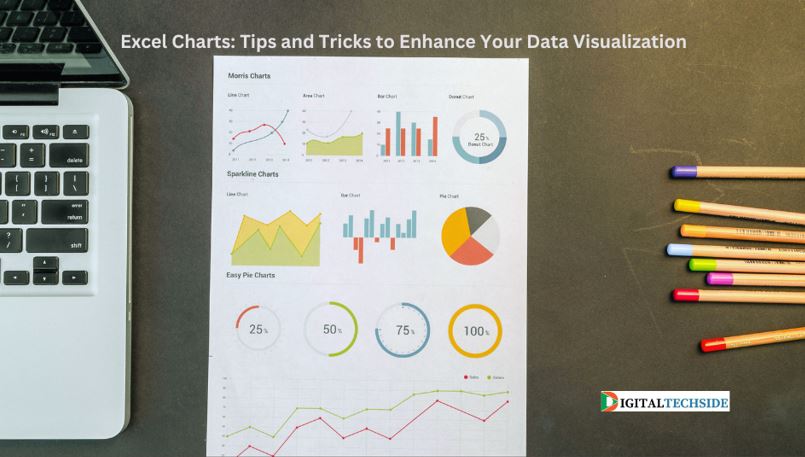
Excel Charts: Tips and Tricks to Enhance Your Data Visualization
Are you weary of presenting your data using conventional, uninspiring tables in Excel charts? Are you eager to engage your audience and breathe life into your data presentations? Look no further!
Within the confines of this blog post, we will embark on a journey through the world of Excel charts, unveiling a treasure trove of invaluable tips and techniques to elevate your data visualization prowess. Whether you wield the mantle of a data analyst, are a seasoned business professional, or simply aspire to convey information in a visually captivating manner, mastering the art of Excel charts will catalyze a transformation in how you communicate your data.
So, fasten your seatbelts and prepare to unleash the full potential of your data through our comprehensive guide to Excel charts!
I. Understanding the Importance of Data Visualization
In our contemporary world, where information holds unparalleled importance, the significance of data cannot be overstated. However, the intrinsic value of raw data often remains obscured when presented in its unrefined state. This is where the art of data visualization takes center stage, serving as an indispensable instrument. Through the transformation of data into visual depictions, you wield the ability to unveil concealed trends, convey intricate insights, and elevate the decision-making process to new heights. The true power of visual storytelling lies in its aptitude to distill intricate concepts into accessible visuals, forging a profound emotional connection with your audience.
A study conducted by Forbes sheds light on this phenomenon, revealing that an impressive 79% of executives recognize the substantial enhancement data visualization brings to their understanding of information. Moreover, research from the University of Minnesota underscores a staggering statistic: the human brain processes visual information a mind-boggling 60,000 times faster than text. These compelling statistics underscore the paramount role of data visualization in our fast-paced world, where short attention spans and the constant deluge of information pose ever-present challenges.
II. Choosing the Right Chart Type for Your Data
When it comes to data visualization in Excel, selecting the appropriate chart type is crucial. Excel offers a wide array of chart types, each designed to convey specific types of data effectively. Understanding the characteristics and applications of different chart types will help you make informed decisions and create visually impactful charts in Excel.
1. Bar Charts:
Bar charts are ideal for comparing categorical data or showing the distribution of a single variable. They are commonly used to display sales figures, survey responses, or market share data. By using different colors or patterns, you can further segment your data within the bars, providing additional insights at a glance.
2. Line Charts:
Line charts are perfect for visualizing trends over time. They are often used to represent stock prices, temperature fluctuations, or sales trends. With line charts, you can easily identify patterns, spot outliers, and illustrate the relationship between variables.
III. Formatting and Customizing Your Charts
Once you’ve chosen the right chart type for your data, it’s your opportunity to infuse creativity and tailor your charts to not only convey information effectively but also to match your unique data and presentation style. Excel generously offers a wide array of formatting choices to empower you to achieve the precise aesthetic and visual impact you desire.
1. Color Scheme and Theme:
Selecting the optimal color palette plays a pivotal role in crafting charts that not only visually captivate but also effectively convey your message. It’s crucial to contemplate the chart’s intent and the emotional response you aim to elicit from your audience. Incorporate contrasting colors to emphasize key data points, and pay careful attention to the color choices, ensuring they remain easily discernible, particularly for individuals with color vision deficiencies. Excel further streamlines this process by offering predefined chart themes, enabling you to seamlessly apply uniform formatting to numerous charts, ultimately conserving valuable time and effort.
2. Fonts and Text Formatting:
Pay attention to the fonts and text formatting in your charts. Use a legible font that matches the tone of your presentation. Consider using bold or italic text to draw attention to specific data labels or annotations. Experiment with different font sizes to ensure readability, keeping in mind that charts may be viewed on various devices and screen sizes.
IV. Adding Data Labels and Annotations
Data labels and annotations provide valuable context and insights to your charts, helping your audience understand the key takeaways at a glance. Excel offers multiple options for adding and formatting data labels and annotations.
1. Data Labels:
Data labels are a powerful tool to directly display the values of data points in your chart. They provide clarity and eliminate the need for referring to legends or axis labels. Excel allows you to customize data labels by choosing their position, format, and even adding additional information, such as percentages or calculated values.
2. Annotations:
Annotations are additional explanatory notes or comments that you can add to your charts to provide further context. They can include explanations, callouts, or references to external sources. Annotations help your audience understand the significance of specific data points or trends, enhancing the overall storytelling aspect of your chart.
V. Utilizing Chart Elements and Features
In addition to formatting and customizing individual chart elements, Excel offers various features that allow you to enhance your charts and provide a more comprehensive visualization of your data.
1. Titles and Legends:
Titles and legends are essential components of any chart or graph. A clear and descriptive title helps set the context and summarize the main message of your chart. Legends, on the other hand, explain the meaning of different colors or patterns used in the chart, making it easier for the audience to interpret the data. Ensure that titles and legends are concise, well-positioned, and easy to read.
2. Axes and Gridlines:
Axes and grid lines provide a reference for interpreting the values represented in your chart. Excel allows you to customize the scales, labels, and formatting of both the horizontal (x-axis) and vertical (y-axis) axes. Gridlines help in aligning data points and facilitate a better understanding of the chart.
VI. Enhancing Charts with Interactive Features
Static charts can be informative, but adding interactive features takes your data visualization to the next level. Excel offers several interactive features that allow your audience to explore the data and gain deeper insights.
1. Slicers:
Slicers provide an interactive way to filter the data in your chart. They allow users to easily slice and dice data based on specific criteria, making it easier to analyze subsets of your data. Slicers are particularly useful when working with large datasets or when you want to provide users with control over what they see in the chart.
2. Scroll Bars:
Scroll bars serve as a valuable tool that empowers users to effortlessly explore expansive datasets or time spans depicted in your chart. They offer a visual overview of the entire dataset or temporal scope, permitting users to pinpoint precise segments and delve into the specific details that pique their interest. The integration of scroll bars introduces a dynamic and interactive dimension to your chart, significantly enriching the user experience.
VII. Using Advanced Charting Techniques
While Excel offers an extensive array of fundamental chart types, delving into advanced techniques can elevate your data visualization to an entirely different level. These sophisticated methods empower you to fashion distinctive and enlightening charts that transcend the confines of conventional options, opening up exciting possibilities for your data presentation.
1. Waterfall Charts:
Waterfall charts are ideal for illustrating the cumulative effect of positive and negative changes in data. They are commonly used to show financial statements, project progress, or budget analysis. Waterfall charts visualize the flow and impact of each data point, making it easier to understand the overall picture and the contributions of different factors.
2. Heat Maps:
Heat maps are a powerful tool for representing data in a two-dimensional format. They use color gradients to display the density or intensity of data values. Heat maps are particularly useful when visualizing large datasets or when you want to highlight patterns, correlations, or outliers.
VIII. Optimizing Performance and Efficiency
As your datasets grow larger and more complex, optimizing the performance and efficiency of your charts becomes crucial. Excel offers various techniques to ensure smooth charting, even with extensive data.
1. Data Range and Source:
One way to optimize chart performance is by selecting the appropriate data range and source. Avoid including unnecessary rows or columns in your data range, as Excel needs to process all the data in the range, which can slow down the chart rendering. Additionally, consider using dynamically named ranges or tables to automatically update your chart as new data is added.
2. Chart Calculations and Refreshing:
If your chart includes calculations or formulas, such as averages or totals, be mindful of their impact on performance. Complex calculations can slow down chart rendering, especially with large datasets. Minimize the number of calculations or consider pre-calculating values to improve chart performance. Additionally, refresh your chart only when necessary, as excessive refreshing can consume system resources.
IX. Visualizing Trends and Patterns
One of the primary objectives of data visualization is to identify trends and patterns that may not be immediately apparent in raw data. Excel charts provide numerous techniques to highlight these trends and patterns effectively.
1. Trendlines:
Trendlines are used to display the underlying trend in your data. They help identify patterns, forecast future trends, or assess the correlation between variables. Excel offers various types of trendlines, including linear, exponential, logarithmic, and polynomial, giving you flexibility in capturing different patterns.
2. Sparklines:
Sparklines are miniature charts that fit within a single cell. They provide a quick and compact visual representation of trends or patterns in your data. Sparklines are particularly useful when you want to show trends over time or compare values across categories without taking up much space.
X. Presenting and Sharing Your Charts
Creating stunning charts is only the first step; effectively presenting and sharing them with your audience is equally important. Excel offers various options to ensure your charts have maximum impact when shared or presented.
1. Slide Presentations:
If you’re incorporating your charts into a slide presentation, consider using PowerPoint, which seamlessly integrates with Excel. Copy and paste your charts into PowerPoint slides, and take advantage of PowerPoint’s features to add animations, transitions, and additional context to your charts.
2. Exporting to Other Formats:
Excel allows you to export your charts to various formats, including PDF, image files (such as JPEG or PNG), or even HTML for web publishing. When exporting, ensure that the chosen format retains the visual integrity and clarity of your charts.
Conclusion:
In conclusion, mastering Excel charts is a game-changer in the world of data visualization. By understanding the importance of data visualization, choosing the right chart type, and leveraging the formatting and customization options, you can transform your data into compelling visual stories. The use of data analytics, labels, annotations, and interactive features adds depth and engagement to your charts. Advanced charting techniques, optimization strategies, and trend visualization further elevate the impact of your charts. Lastly, presenting and sharing your charts effectively ensures that your audience fully grasps the insights you’ve uncovered.
As a DIGITALTECHSIDE author, the majority of our articles have been focused on technology, blogging, business, lifestyle, social media, web design and development, e-commerce, money, health, education, entertainment, SEO, travel, and sports.
Contact us at digitaltechside@gmail.com if you have questions of anything.